Monday, May 11, 2015

Presidential Primaries: April Polling Averages Update

The U.S. presidential polling averages have been updated for the month of April. Five polls have been released this month for the Republicans. Two of them have Jeb Bush in the lead, two put Marco Rubio up front, and one poll has Scott Walker leading. Only one Democratic poll has been released with Elizabeth Warren. Many polling firms are no longer including her, so if further polls do not include the Massachusetts senator, then I will have to update the numbers for the Democrats and remove Warren. The one poll I included for the Democrats has Hillary Clinton with a comfortable lead with Warren in second and Joe Biden in third.

Republican Nomination

Changes in position (rank) and percentage points are indicated by green for an increase, red for a decrease, and nothing if the candidate's position remains unchanged. Note that these are changes since the March update, not the most recent polling average.

1. Jeb Bush: 14.5% (-1.7 pp)
2. Scott Walker: 14% (-1.8 pp)
3. Marco Rubio: 12.8% (+4, +6.5 pp)
4. Ted Cruz: 9.3% (+2, +0.7 pp)
5. Rand Paul: 9.2% (+0.4 pp)
6. Mike Huckabee: 7.4% (-2, -1.6 pp)
7. Ben Carson: 6.1% (-4, -3.2 pp)
8. Chris Christie: 5.3% (-0.7 pp)
9. Rick Perry: 2.6%
10. John Kasich: 1.8% (+2, +0.4 pp)
11. Rick Santorum: 1.6% (-1, -0.2 pp)
12. Bobby Jindal: 1.4% (-1, -0.3 pp)
13. Lindsey Graham: 1.4%
14. Carly Fiorina: 1.3%
 
Note: Carly Fiorina and Lindsey Graham have been added to the list. 
 
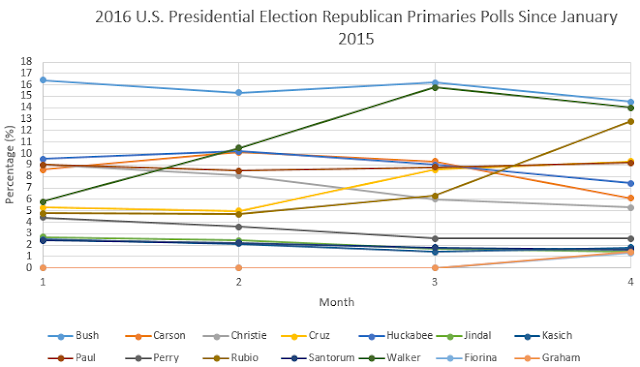
Below is a graph showing the candidates' polling averages after each month in 2015. Note that month 1 means January, 2 means February, and so on. 


Bush: Bush's numbers went down this month as his friend and fellow Florida politician, Marco Rubio, declared candidacy. He is still in the lead, but is only half a percentage point above Walker. The polls have given Bush a variety of percentages. NBC/The Wall Street Journal gave him 23%, while The Economist and Fox News put him at only 9%, in third place.

Walker: The Wisconsin governor's polling average has gone down for the first time after a rapid increase from January to March. However, he is close behind Jeb Bush. For a brief time in mid-April (one polling average update), Walker was just ahead of Bush.

Rubio: Rubio's polling average more than doubled after he announced that he would seek the Republican nomination for president. With nearly 13%, Rubio can now be considered a front-runner.

Cruz: The Texas senator has gone up this month and is in fourth place, still a contender for the Republican nomination. He was in third in a previous polling update.

Paul: Rand Paul also experienced a polling bump after announcing candidacy. He has maintained this fifth place position and has been polling quite consistently.

Huckabee: The 2008 Republican primary contender has dropped two places. However, the polling average here does not include polls that were taken after he announced that he would run for president. 

Carson: Dr. Ben Carson has had the biggest fall this month. He was in third place in March with 9.3%, but he is now at only 6.1% and in seventh. Carson also said that he will run for president, but March polls do not reflect this as they were taken beforehand.

Christie: Christie is still continuing in a downward trend.

Perry: The former Texas governor's polling average has not changed since March.

Kasich: The Ohio governor's average increased very slightly, but enough to place him ahead of Santorum and Jindal.

Santorum: The 2012 Republican primary runner-up has polled no higher than 3% this month.

Jindal: Jindal is in 12th place with poor polling results.

Graham: The senior senator from South Carolina has been added to the list. He is currently polling at 1.4%, less than a percentage point behind Bobby Jindal.

Fiorina: A former business executive, Fiorina is currently polling at 1.3%. She is the only major female Republican candidate and is also one of the wealthiest candidates running.

The Republicans appear to have separated into three main tiers: the front-runners (Bush, Walker, and Rubio), the challengers (Cruz to Christie), and the long-shots (Perry to Fiorina). All these levels are based solely on polls. Larry J. Sabato, from the University of Virginia, has made a great classification of the Republican and Democratic candidates and has categorized them. His tiers are based not only on polls, but also political experience, money, and support. I recommend that you check it out and subscribe to his email newsletters. 


Democratic Nomination

Changes in position (rank) and percentage points are indicated by green for an increase, red for a decrease, and nothing if the candidate's position remains unchanged. Note that these are changes since the March update, not the most recent polling average.

1. Hillary Clinton: 59.9% (-0.3 pp)
2. Elizabeth Warren: 12.1% (+1, +0.4 pp)
3. Joe Biden: 11.4% (-1, -1.8 pp)
4. Bernie Sanders: 4.2% (+0.3 pp)
5. Martin O'Malley: 1.3% (+1)
6. Jim Webb: 1.1% (-1, -0.2 pp)

Below is a graph showing the candidates' polling averages after each month in 2015. Note that month 1 means January, 2 means February, and so on.


Clinton: The former First Lady and Secretary of State is still well ahead of the pack.

Warren: Warren has overtaken Joe Biden, but is still miles behind Hillary Clinton.

Biden: The vice-president is now behind Warren and is in third place.

Sanders: The independent senator from Vermont (he caucuses with the Democrats) has been polling consistently. He announced that he would run for president on April 30. This is not reflected in this month's poll.

O'Malley: Martin O'Malley is still in front of Jim Webb, but the recent Baltimore riots may cause him some trouble in future polls.

Webb: The Virginia senator is polling at 1.1% and is in sixth.

The Democratic primary is much less competitive than the GOP field and some believe that it will be more of a coronation than a contest.

Canada Federal Election: April Polling Averages

The polling averages for the month of April (up to April 30) have been updated.


The graph below illustrates each party's polling average for each month. The parties are listed by popular vote rank, and in brackets the rank and percentage point change is given. Green means an increase, while red means a decrease. If nothing is written, then no change has taken place.


1. Conservatives: 32.7% (+0.3 pp). The Conservatives have had a small increase in their polling average and have maintained their lead over the Liberals for the second month in a row. The latest poll by Abacus Data, pegging the party at 36%, is their highest since January 2013.

2. Liberals: 29.8% (-0.7 pp). The Liberals are polling their lowest since Trudeau was elected leader. They have lost the lead over the Conservatives and their support is slowly declining.

3. NDP: 22.7% (+1.1 pp). The NDP have made the biggest improvement this month and have gone up nearly 3 points since the beginning of the year. Much of the NDP's gains can be attributed to the Liberal's losses.

4. Green Party: 7.9% (-0.3 pp). The Greens have experienced a very slight drop this month, but are still ahead of the Bloc Quebecois. However, they are polling quite well now. The EKOS poll from April 28 gave them 9.9%. The question now is whether those who say that they intend to vote Green will actually do so.

5. Bloc Quebecois: 4.4% (-0.6 pp). The Bloc Quebecois have also experienced a dip this month. However, most polls consistently put the Bloc Quebecois at 4 or 5 percent.

6. Others: 2.5% (+0.2 pp). Other parties and independents are polling just about the same today as they were last month.

Regional Model

I am working on a regional model. It works just like the national model, but for each of Canada's main regions.

Atlantic

LPC: 45.1%, 26 seats
CPC: 23%, 3 seats
NDP: 21.5 %, 3 seats
GPC: 7.5%, 0 seats
Others: 2.8%, 0 seats

Quebec

NDP: 26.8%, 29 seats
LPC: 24.8%, 23 seats
CPC: 22.2%, 16 seats
BQ: 18.5%, 10 seats
GPC: 5.2%, 0 seats
Others: 2.4%, 0 seats

Ontario

CPC: 37%, 66 seats
LPC: 32.3%, 44 seats
NDP: 20.1%, 11 seats
GPC: 7.4%, 0 seats
Others: 3.2%, 0 seats

Manitoba and Saskatchewan

CPC: 40.5%, 18 seats
LPC: 29.6%, 7 seats
NDP: 21.2%, 3 seats
GPC: 6.6%, 0 seats
Others: 2.1%, 0 seats

Alberta

CPC: 42.9%, 26 seats
NDP: 24%, 5 seats
LPC: 21.5%, 3 seats
GPC: 6.8%, 0 seats
Others: 4.8%, 0 seats

British Columbia


CPC: 31.4%, 19 seats
LPC: 27.7%, 13 seats
NDP: 24.2%, 8 seats
GPC: 14.3%, 2 seats
Others: 2.4%, 0 seats

The Territories

CPC:  2 seats
LPC:  0 seats
NDP:  1 seats
GPC:  0 seats
Others: 0 seats
Note: There is no polling data in the territories, so I have to make the assumption that the incumbent wins. Since there are no polls, I cannot add any percentage figures either.

Canada

CPC:  150 seats
LPC:  116 seats
NDP:  60 seats
BQ: 10 seats
GPC:  2 seats
Others: 0 seats

This regional aggregate gives the Conservatives and Bloc Quebecois more seats and the NDP and Green Party less seats. This is because of regional concentrations of voting habits. Also note that this model uses the cube rule instead of the square rule. During the 2011 Canadian federal election, the cube rule was more accurate on the regional level (the square rule was better on the national level).


Thursday, May 07, 2015

2015 UK Election Projection: Tight Race Expected Between Conservatives and Labour

Today (May 7) is the United Kingdom general election. Here is my projection:

Square Rule

Conservatives: 33.5%, 286 seats
Labour: 33.4%, 285 seats
United Kingdom Independence Party: 12.6%, 40 seats
Liberal-Democrats: 9.4%, 23 seats
Others: 6.4%, 10 seats
Green: 4.7%, 6 seats

Cube Rule

Conservatives: 33.5%, 313 seats
Labour: 33.4%, 310 seats
United Kingdom Independence Party: 12.6%, 17 seats
Liberal-Democrats: 9.4%, 7 seats
Others: 6.4%, 2 seats
Green: 4.7%, 1 seats
Square Rule (with bias adjustments)

Labour: 35.1%, 292 seats
Conservatives: 34.8%, 287 seats
United Kingdom Independence Party: 13.6%, 44 seats
Others: 7.4%, 13 seats
Green: 5.7%, 7 seatsLiberal-Democrats: 5.4%, 7 seats

Cube Rule (with bias adjustments)

Labour: 35.1%, 317 seats
Conservatives: 34.8%, 309 seats
United Kingdom Independence Party: 13.6%, 19 seats
Others: 7.4%, 3 seats
Green: 5.7%, 1 seatsLiberal-Democrats: 5.4%, 1 seats

All of these models show an extremely close race between the Conservatives and the Labour. A seat and vote range can be found by combining all of these models and adding standard deviation.

Conservatives: 31.8 - 36.5%, 258 - 405 seats
Labour: 32.2 - 36.3%, 265 - 351 seats
United Kingdom Independence Party: 10.7 - 15.5%, 10 - 57 seats
Liberal Democrats: 4.6 - 10.2%: 1 - 27 seats
Others: 5.5 - 8.3%, 1 - 16 seats
Green: 3.8 - 6.6%, 0 - 11 seats

Both the Conservatives and Labour have a shot at forming government (getting a majority) by winning at least 326 seats, but a hung parliament (minority or coalition government) is the more likely scenario. These two parties are extremely close. David Cameron may be re-elected or Ed Miliband will become the new British prime minister. UKIP will likely become the third party and the Liberal Democrats may be fourth. Other parties, including the Democratic Unionist Party, Scottish National Party, Sinn Féin, Plaid Cymru, Alliance Party of Northern Ireland, Social Democratic and Labour Party, Respect Party, independents, and others can receive up to 16 seats. The Green Party may receive maximum 11 seats, but possibly none at all.


Monday, May 04, 2015

Alberta Election 2015: NDP Majority Projected

The Alberta provincial election will take place on May 5. I have used this election to test my polling models. All models project an NDP majority.

Square rule

NDP: 42.7%, 53 seats
Wildrose: 25.1%, 18 seats
Progressive Conservatives: 22.3%, 15 seats
Liberals: 5.5%, 1 seat
Alberta Party: 3.3%, 0 seats
Others: 1.2%, 0 seats

Cube rule

NDP: 42.7%, 65 seats
Wildrose: 25.1%, 13 seats
Progressive Conservatives: 22.3%, 9 seats
Liberals: 5.5%, 0 seats
Alberta Party: 3.3%, 0 seats
Others: 1.2%, 0 seats

However, during the 2012 Alberta general election, most pollsters were forecasting a Wildrose majority. Instead, the PC's held on to a majority. The sample sizes were smaller then and methods have probably improved, so I expect pollsters to be more accurate now. However, in case they make a big mistake again, I have included models with bias adjustments. 

Square rule, with bias adjustments

NDP: 40.7%, 46 seats
PC: 32.6%, 30 seats
Wildrose: 19%, 10 seats
Liberals: 5%, 1 seat
Alberta Party: 1.6%, 0 seats
Others: 0.5%, 0 seats

Cube rule, with bias adjustments
NDP: 40.7%, 54 seats
PC: 32.6%, 28 seats
Wildrose: 19%, 5 seats
Liberals: 5%, 0 seat
Alberta Party: 1.6%, 0 seats
Others: 0.5%, 0 seats

In every model, the New Democrats get a majority. Either the PC's or the Wildrose Party will become the Official Opposition. 

If we look at the extreme ranges of all the models and include standard deviation and largest margin of error, we get the following result:

NDP: 33.7 - 49.7%, 32 - 87 seats
PC: 15.5 - 39.4%, 3 - 49 seats
Wildrose: 12.7 - 31.4%, 3 - 29 seats
Liberals: 0 - 11.8%, 0 - 4 seats
Alberta Party: 0.4 - 8.6%, 0 - 2 seats
Others: 0 - 6.2%, 0 - 1 seats

It is most likely that an NDP majority will occur. An NDP minority is also a possibility. The Progressive Conservatives may be able to sneak in a razor-thin majority or a bare plurality, but both they and the NDP would have to score at the extreme ends of the range. The Official Opposition will most likely be the PC's or the Wildrose Party, but if Jim Prentice is re-elected, the NDP would become the Official Opposition. The Liberals cannot hope for any more than 4 seats. The Alberta Party can win at most 2 seats. Other parties and independents are projected to receive maximum 1 seat, but most likely none.