Showing posts with label Canada Federal Election 2015. Show all posts

Monday, October 19, 2015

Canada Federal Election 2015 Final Projection

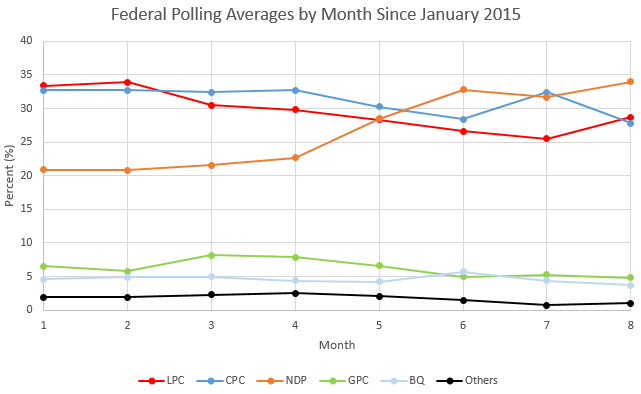
Liberals Surge to the Lead

The Liberals are projected to win a strong minority, but the Conservatives still have a shot.


Note: 10 means election day.

1. LPC: 37.5%
2. CPC: 31.2%
3. NDP: 21.2%
4. BQ: 4.8%
5. GPC: 4.5%
6. Others: 0.8%

Regional Model

Atlantic: Clear Liberal Lead

1. LPC: 49.3%, 22-27 seats
2. NDP: 22.9%, 3-5 seats
3. CPC: 22.4%, 2-5 seats
4. GPC: 3.7%, 0 seats
5. Others:  1.6%, 0 seats

Quebec: Close Race between Liberals and New Democrats

1. LPC: 30.1%, 29-34 seats
2. NDP: 27%, 23-25 seats
3. BQ: 20%, 12 seats
4. CPC: 19.5%, 10-13 seats
5. GPC: 2.6%, 0-1 seats
6. Others:  0.8%, 0 seats

Ontario: Liberals Lead the Tories

1. LPC: 44.6%, 70-81 seats
2. CPC: 33.6%, 35-40 seats
3. NDP: 17.7%, 5-11 seats
4. GPC: 3.6%, 0 seats
5. Others:  0.6%, 0 seats

Manitoba and Saskatchewan: Conservatives Maintain Lead over Liberals

1. CPC: 41.5%, 15-17 seats
2. LPC: 32.9%, 9 seats
3. NDP 20.9%, 2-4 seats
4. GPC: 4.1%, 0 seats
5. Others:  0.6%, 0 seats
 
Alberta: Strong Conservative Lead

1. CPC: 51.9%, 25-29 seats
2. LPC: 26.5%, 4-6 seats
3. NDP: 16.6%, 1-3 seats
4. GPC: 4.1%, 0 seats
5. Others:  0.9%, 0 seats

British Columbia: Liberal or Conservative Toss-up with NDP in Strong Third

1. LPC: 31.5%, 15-16 seats
2. CPC: 31.4%, 15-16 seats
3. NDP: 26.1%, 9-10 seats
4. GPC: 10.5%, 1-2 seats
5. Others:  0.4%, 0 seats
 
The Territories: Incumbents Keep Their Ridings

CPC:  2 seats
NDP:  1 seats
LPC:  0 seats
GPC:  0 seats
Others: 0 seats

Canada: Strong Liberal Minority with the Possibility of a Slim Majority

1. LPC: 151-171 seats
2. CPC: 110-114 seats
3. NDP: 46-57 seats
4. BQ: 10-13 seats
5. GPC: 1-3 seats
6. Others: 0 seats

Extreme Ranges

LPC: 22%-43.1%; 38-292 seats
CPC: 26.3-38.8%; 66-213 seats
NDP: 14.9-35.2%; 0-159 seats
BQ: 0-9.6%; 0-12 seats
GPC: 0-10%; 0-12 seats
Others: 0-5.5%; 0-4 seats

Analysis

This election will be very close. Anything can happen. While the polls show the Liberals with a healthy lead, the question remains whether or not the Liberal supporters will actually show up to vote. Conservatives tend to have the most committed voters and are good at getting out the vote. Combining the fact that incumbents and right-leaning parties tend to get underrepresented by polls adds another factor this race that cannot be ignored. The Liberals may win a minority or majority, but a Conservative minority or even a second majority is not out of the equation yet. The New Democrats will likely become relegated to third place status, but still have a shot at forming a minority government. The Bloc Quebecois will rebound slightly. Both the Bloc and the Green Party have a shot at gaining official party status, but it is possible that the Bloquistes and Greens may disappear from the House of Commons altogether. Independents and other parties (including the Quebec-based Strength in Democracy) may gain as many as four seats this election. 

Monday, October 12, 2015

Canada Federal Election: September Polling Averages

NDP Campaign Collapsing, While Conservatives and Liberals Make Gains


1. CPC: 32.7%
2. LPC: 29.7%
3. NDP: 27%
4. GPC: 5%
5. BQ: 4.9%
6. Others: 0.7%

Regional Model

Atlantic

1. LPC: 42.8%, 22 seats
2. NDP: 27.2%, 6 seats
3. CPC: 23.7%, 4 seats
4. GPC: 5.6%, 0 seats
5. Others:  0.7%, 0 seats

Quebec

1. NDP: 31.3%, 40 seats
2. LPC: 22.2%, 14 seats
3. BQ: 21.3%, 12 seats
4. CPC: 20.9%, 12 seats
5. GPC: 3.4%, 0 seats
6. Others:  0.9%, 0 seats

Ontario

1. CPC: 35.8%, 56 seats
2. LPC: 34%, 48 seats
3. NDP: 24.1%, 17 seats
4. GPC: 5.4%, 0 seats
5. Others:  0.8%, 0 seats

Manitoba and Saskatchewan

1. CPC: 40.3%, 18 seats
2. LPC: 27.3%, 6 seats
3. NDP 25.4%, 4 seats
4. GPC: 6.1%, 0 seats
5. Others:  0.8%, 0 seats
 
Alberta

1. CPC: 53.3%, 30 seats
2. LPC: 22.2%, 2 seats
3. NDP: 19.4%, 2 seats
4. GPC: 3.3%, 0 seats
5. Others:  1.8%, 0 seats

British Columbia

1. NDP: 32.6%, 17 seats
2. CPC: 31.4%, 16 seats
3. LPC: 25.6%, 8 seats
4. GPC: 10.1%, 1 seats
5. Others:  0.3%, 0 seats
 
The Territories

CPC:  2 seats
NDP:  1 seats
LPC:  0 seats
GPC:  0 seats
Others: 0 seats

Canada

1. CPC: 138 seats
2. LPC: 100 seats
3. NDP: 87 seats
4. BQ: 12 seats
5. GPC: 1 seats
6. Others: 0 seats
 

Saturday, September 26, 2015

Canada Federal Election: August Polling Averages

Conservatives Slip to Third Place in Close Three-Way Race


1. NDP: 34%
2. LPC: 28.7%
3. CPC: 27.8%
4. GPC: 4.8%
5. BQ: 3.7%
6. Others: 1.7%

Regional Model

Atlantic

1. LPC: 37.3%, 17 seats
2. NDP: 30.5%, 9 seats
3. CPC: 26.9%, 6 seats
4. GPC: 4.3%, 0 seats
5. Others:  0.9%, 0 seats


Quebec

1. NDP: 43.7%, 65 seats
2. LPC: 20.8%, 7 seats
3. BQ: 16.2%, 3 seats
4. CPC: 15.1%, 3 seats
5. GPC: 3.1%, 0 seats
6. Others:  1%, 0 seats


Ontario

1. CPC: 32.2%, 44 seats
2. LPC: 32.1%, 33 seats
3. NDP: 29.4%, 33 seats
4. GPC: 5.2%, 0 seats
5. Others:  1.1%, 0 seats

 Manitoba and Saskatchewan

1. CPC: 42.2%, 19 seats
2. NDP: 27.2%, 5 seats
3. LPC: 24.7%, 4 seats
4. GPC: 4.1%, 0 seats
5. Others:  1.8%, 0 seats

 
Alberta

1. CPC: 49.3%, 29 seats
2. NDP: 26.1%, 4 seats
3. LPC: 17.6%, 1 seats
4. GPC: 4.7%, 0 seats
5. Others:  2.3%, 0 seats

 
British Columbia

1. NDP: 34.5%, 21 seats
2. CPC: 29.3%, 13 seats
3. LPC: 24.8%, 8 seats
4. GPC: 10.4%, 0 seats
5. Others:  0.9%, 0 seats

 
The Territories

CPC:  2 seats
LPC:  0 seats
NDP:  1 seats
GPC:  0 seats
Others: 0 seats

Canada

1. NDP: 138 seats
2. CPC: 116 seats
3. LPC: 81 seats
4. BQ: 3 seats
5. GPC: 0 seats
6. Others: 0 seats


Tuesday, August 11, 2015

Canada Federal Election: July Polling Averages

Conservatives Make a Comeback

Thirteen polls were released in the month of July by eight polling firms. 7 of these 13 polls had the NDP in the lead, 2 had the Conservatives up front, and 4 polls showed the two parties head-to-head. The Tories now lead in the aggregate. A big reason for this polling jump can be attributed to the poll conducted by Mainstreet Research that put the Conservatives in majority territory with 38%, the Dippers at 27%, and the Liberals at 25%. An impressive 5147 Canadians were surveyed making this poll have one of the largest sample sizes since 2011. But is it an outlier? Possibly, but considering the fact that hundreds of polls have been released since the last federal election, it is on the high end of the spectrum.

The polling averages up to July 31 can be seen below:

The graph below illustrates each party's polling average for each month. The parties are listed by popular vote rank, and in brackets the rank and percentage point change is given. Green means an increase, while red means a decrease. If nothing is written, then no change has taken place. 


 1. Conservatives: 32.4% (+4.0 pp). The Conservatives made the biggest leap this month, rising by 4 percentage points. The size of this jump is nearly as big as the one made by the NDP last month.

2. NDP: 31.7% (-1.1 pp). The Dippers have lost some of their momentum, but still remain only 0.7 percentage points behind the Tories.

3. Liberals: 25.5% (-1.1 pp). The Liberals continued to drop in July. Justin Trudeau and the Liberals must come up with a new strategy to halt this decline and prevent the election from becoming a two-way race between the Conservatives and New Democrats.

4. Green Party: 5.3% (+0.3 pp). The Greens have managed to hold steady this month, but have overcome the Bloc Quebecois both in seats and popular vote. 

5. Bloc Quebecois: 4.4% (-1.3 pp). The post-leadership bump that took place after Gilles Duceppe became leader of the Bloc appears to have died off and the Bloquistes are back to their original level of 4%.

6. Others: 0.7% (-0.8 pp): Other parties (including Strength in Democracy) and independents currently have less than one percent of the vote. 

Regional Model

Atlantic

LPC: 37.3%, 17 seats
(+4.5 pp, 4)
NDP: 30.5 %, 9 seats (+1.9 pp, 1)
CPC: 26.8%, 6 seats (-4.0 pp, -5)
GPC: 4.9%, 0 seats (-0.4 pp, 0)
Others: 0.5%, 0 seats (
-2.1 pp pp, 0)

In June, the Atlantic provinces appeared like a three-way race, but now the Liberals are beginning to move further away from the pack, while the Conservatives are losing seats.

Quebec

NDP: 36.3%, 52 seats (+2.2 pp, 5)
LPC: 21.8%, 11 seats (-0.2 pp, -2)
CPC: 19.7%, 8 seats (+3.0 pp, 2)
BQ: 18.4%, 7 seats (-3.5 pp, -5)
GPC: 2.7%, 0 seats (-2.5 pp, 0)
Others: 1.2%, 0 seats (-1.2 pp, 0)

The NDP has led in every poll in Quebec this month. The Bloc has fallen back to fourth place, losing several seats. The Conservatives have managed to make some inroads in the province are now ahead of the Bloquistes.

Ontario

CPC: 37.3%, 65 seats (+5.7  pp, 23)
LPC: 28.9%, 30 seats (-1.0 pp, -6)
NDP: 27.7%, 26 seats (4.1 pp, -17)
GPC: 5.3%, 0 seats (+0.6  pp, 0)
Others: 0.7%, 0 seats (-1.4 pp, 0)

After losing 20 seats in Ontario last month, the Conservatives gained 23 this month, netting 3 seats since May. The Tories now have a clear lead in this key battleground province, while the New Democrats (especially) and the Liberals suffered heavy losses in July.

Manitoba and Saskatchewan

CPC: 43.9%, 20 seats (+4.4 pp, 3)
NDP: 27.3%, 5 seats (-1.0 pp, -1)
LPC: 23.7%, 3 seats (-1.7 pp, -2)
GPC: 4.8%, 0 seats (-0.7 pp, 0)
Others: 0.3%, 0 seats (-2.0 pp, 0)

The Conservatives maintain a large lead in the Prairies.

Note: Most pollsters combine Manitoba and Saskatchewan, but EKOS and the Angus Reid Forum poll them separately. If this is the case, the raw average of the Manitoba and Saskatchewan numbers (including sample size) are calculated, since the two provinces have a similar population and the same amount of seats in the House of Commons. 

Alberta

CPC: 49.8%, 29 seats (+2.3 pp, 3)
NDP: 25.9%, 4 seats (-3.1 pp, -3)
LPC: 17.6%, 1 seats (+0.2 pp, 0)
GPC: 5.4%, 0 seats (+1.6 pp, 0)
Others: 1.3%, 0 seats (-1.0 pp, 0)

Other than Conservative gains and New Democrat losses, not much has happened in Alberta.

British Columbia

NDP: 40.4%, 28 seats (+2.0 pp, 1)
CPC: 28.9%, 10 seats (+3.1 pp, 2)
LPC: 21.3%, 4 seats (-2.0 pp, -2)
GPC: 8.7%, 0 seats (-2.0 pp, -1)
Others: 0.7%, 0 seats (-1.1 pp, 0)

The Conservatives made the biggest gain in B.C. in July, but still remain over 10 points behind the NDP. The Green Party has lost their only seat.

The Territories

CPC:  2 seats
LPC:  0 seats
NDP:  1 seats
GPC:  0 seats
Others: 0 seats

Note: There is no polling data in the territories, so I have to make the assumption that the incumbent wins. Since there are no polls, I cannot add any percentage figures either. Some models combine the North with Manitoba and Saskatchewan, but this can be inaccurate, since there are countless differences between the lifestyle in the Prairies and the way of life of the people of Canada's northern regions.

Canada
 
CPC:  140 seats (+27)
NDP:  125 seats (-13)
LPC:  66 seats (-8)
BQ: 7 seats (-5)
GPC:  0 seats (-1)
Others: 0 seats (0)

The Tories have picked up nearly thirty seats while the New Democrats lost a baker's dozen. The Liberals continue to lose seats, while the Bloc has fallen back to May levels in seat count. The Greens would have no seat in the House of Commons if any election were held today. 

The regional model gives a stronger minority for the Conservatives than the national model. This is largely due to regional trends, especially prevalent in Quebec and British Columbia. The Bloc Quebecois managed to pick up several seats in Quebec since almost one in five Quebecers will vote for them, while they have no candidates in any other province or territory. Meanwhile the Greens capture around 5% of the vote in each province, but except in the case of B.C. (occasionally), their support does not exceed 10% putting them out of the range of getting any seats.


Tuesday, July 07, 2015

Canada Federal Election: June Polling Averages

NDP Set to Form the Next Government, Bloc Quebecois Rebounds

 June was a busy week for pollsters. Eleven polls were released by five different polling firms. Ten of those polls had the New Democrats in the lead (a Forum poll from June 5 had the Liberals at 32%, the Tories at 31%, and the NDP in third with 28%). With these updated polling figures, the NDP would form a minority government. Another story this month is the resurgence of the Bloc Quebecois after Gilles Duceppe announced that he would once again lead the party. The Bloquistes are now in front of the Green Party.


The polling averages up to June 29 can be seen below:


The graph below illustrates each party's polling average for each month. The parties are listed by popular vote rank, and in brackets the rank and percentage point change is given. Green means an increase, while red means a decrease. If nothing is written, then no change has taken place. 

  
 1. NDP: 32.8% (+4.3 pp). The New Democrats made another big leap this month and are now in the lead. Since, the NDP has increased by about ten points and they do not appear to be losing momentum. 
2. Conservatives: 28.4% (-1.9 pp). The Tories were the biggest losers this month, dropping by nearly two points. If an election were to be held today, the Conservatives would probably form the Official Opposition. However, as seen in several previous elections (United Kingdom 2015, Alberta 2015, Ontario 2014, Alberta 2011, Canada 2011), the incumbent was always polled far lower than the actual result. This is the only good news for the Conservatives this month. 
3. Liberals: 26.6% (-1.7 pp). The Liberals remain relegated to third party status and many of their losses can be attributed to the NDP's rise. Justin Trudeau will have to step up his game if he wants "Canada's natural governing party" to come up in the lead once again.

4. Bloc Quebecois: 5.7% (+1.5 pp). The only party other than the NDP to improve this month has been the Bloc Quebecois. With Gilles Duceppe returning as the party leader, the Bloquistes from 2011 are returning as well as some other Quebecois separatists and sovereignists. The Bloc is now ahead of the Green Party. 
5. Green Party: 5% (-1.6 pp). The Greens have been on the decline since their March high of 8.2%. It seems that many former Green Party supporters are flocking over to the NDP.
6. Others: 1.5% (-0.7 pp): Other parties and independents currently have about 1.5% of the vote. 

Regional Model

The regional model may actually be slightly more accurate than the national one. Some parties, such as the Bloc Quebecois, benefit greatly from regional variations, so there are some significant discrepancies between the national and regional seat counts. However, a drawback to the regional model is smaller sample sizes and older polls (Ipsos-Reid did not include any regional numbers and Environics did not include sample sizes in each province).
Atlantic

LPC: 32.8%, 13 seats (-12 pp, -5)
CPC: 30.8%, 11 seats (+2.1 pp, 2)
NDP: 28.6 %, 8 seats (+4 pp, 3)
GPC: 5.3%, 0 seats (-2.5 pp, 0)
Others: 2.6%, 0 seats (0 pp, 0)

Both the Conservatives and New Democrats have improved in the Atlantic provinces, while the Liberals continue to slide.

Quebec

NDP: 34.1%, 47 seats (+1.2 pp, 2)
LPC: 22%, 13 seats (-2.4 pp, -6)
BQ: 21.9%, 12 seats (+4.6 pp, 5)
CPC: 16.7%, 6 seats (-1.2 pp, -1)
GPC: 5.2%, 0 seats (-1.5 pp, 0)
Others: 2.4%, 0 seats (-0.8 pp, 0)

The Bloc Quebecois have been the biggest winners in Quebec this month. They have gained 5 more seats are now right behind the Liberals for third place in the province.

Ontario

NDP: 31.8%, 43 seats (+9.9  pp, 29)
CPC: 31.6%, 42 seats (-4.4 pp, -20)
LPC: 29.9%, 36 seats (-2.5 pp, -9)
GPC: 4.7%, 0 seats (-2.3 pp, 0)
Others: 2.1%, 0 seats (-0.6 pp, 0)

The New Democrats have netted nearly 29 seats in the seat-rich province of Ontario, putting them at a virtual tie with the Conservatives, who along with the Liberals, are rapidly losing seats in the province.

Manitoba and Saskatchewan

CPC: 39.5%, 17 seats (-1.6 pp, -2)
NDP: 28.3%, 6 seats (+3.2 pp, 2)
LPC: 25.4%, 5 seats (-0.7 pp, 0)
GPC: 5.5%, 0 seats (-0.7 pp, 0)
Others: 2.3%, 0 seats (-0.2 pp, 0)

Things have been pretty static in Manitoba and Saskatchewan with the Conservatives holding a comfortable lead.

Note: Most pollsters combine Manitoba and Saskatchewan, but EKOS and the Angus Reid Forum poll them separately. If this is the case, the raw average of the Manitoba and Saskatchewan numbers (including sample size) are calculated, since the two provinces have a similar population and the same amount of seats in the House of Commons. 

Alberta

CPC: 47.5%, 26 seats (+2 pp, 0)
NDP: 29%, 7 seats (+2.6 pp, +1)
LPC: 17.4%, 1 seats (-0.8 pp, -1)
GPC: 3.8%, 0 seats (-2.1 pp, 0)
Others: 2.3%, 0 seats (-2.2 pp, 0)

Even though the most recent Albertan general election may have been the catalyst that drove the rise of the NDP federally, on the provincial level, the Conservatives are doing very well in Alberta. The NDP have experienced a small uptick as well, while the Liberals, Greens, and other parties and independents are losing support.

British Columbia

NDP: 38.4%, 27 seats (+8.8 pp, 11)
CPC: 25.8%, 8 seats (-2.3 pp, -5)
LPC: 23.3%, 6 seats (-3.2 pp, -5)
GPC: 10.7%, 1 seats (-2.8 pp, -1)
Others: 1.8%, 0 seats (-0.5 pp, 0)

The NDP has jumped up to a very comfortable lead in BC. All other parties have dropped. The Green Party have lost their only other seat in British Columbia and are now down from 2 to 1 seat in the regional model.

The Territories

CPC:  2 seats
LPC:  0 seats
NDP:  1 seats
GPC:  0 seats
Others: 0 seats

Note: There is no polling data in the territories, so I have to make the assumption that the incumbent wins. Since there are no polls, I cannot add any percentage figures either. Some models combine the North with Manitoba and Saskatchewan, but this can be inaccurate, since there are countless differences between the lifestyle in the Prairies and the way of life of the people of Canada's northern regions.

Canada

NDP:  138 seats (+48)
CPC:  113 seats (-26)
LPC:  74 seats (-26)
BQ: 12 seats (+5)
GPC:  1 seat (-1)
Others: 0 seats (0)

The New Democrats would form a minority government with the Conservatives as the Official Opposition. The Bloc Quebecois would regain their official party status meeting the requirement of having at least 10 seats in the House of Commons. 

The regional model is very consistent with the federal model for the NDP (138 regional vs 137 national).  Note that the regional model uses the cube rule, while the national model uses the square rule. Which one is superior? We'll find out on election day.

Friday, June 12, 2015

Canada Federal Election: May Polling Averages

NDP Rises to Second Place, While Conservatives and Liberals Drop

The Canadian federal election is now officially a three-way race. The Conservatives still hold onto the lead, but the New Democrats have now just barely overtaken the Liberal Party for second place. 

The polling averages up to May 31 can be seen below:

The graph below illustrates each party's polling average for each month. The parties are listed by popular vote rank, and in brackets the rank and percentage point change is given. Green means an increase, while red means a decrease. If nothing is written, then no change has taken place.

 1. Conservatives: 30.3% (-2.4 pp). The Tories suffered the biggest drop this month. The best poll they had this month was 32.9%, while their lowest poll had them at 28.1%. The lowest the Conservatives have ever polled since the 2011 election was 24.9%, so this appears to be their hard-core supporters. This means that so far the Conservatives have acquired only about 5% of swing or leaning voters. 

2. NDP: 28.5% (+5.8 pp). The New Democrats have surged into second place. They have jumped an incredible 6 points. They are the only party that has gone up this month, implying that some voters from all the major federal parties are flocking over the NDP. This rise has been confirmed by multiple polling firms, including EKOS, Forum, Ipsos Reid, Nanos, and Abacus. However, the question now is whether or not this momentum will last.

3. Liberals: 28.3% (-1.5 pp). The Liberals are virtually tied with the NDP, with a difference of only 0.2 percentage points. This is the first time in quite a while now, since the Liberals have returned to third place. This is also their third consecutive month of dropping since February. 

4. Green Party: 6.6% (-1.3 pp). The Greens have experienced a drop this month. However, they are still ahead of the Bloc Quebecois.

5. Bloc Quebecois: 4.2% (-0.2 pp). The Bloc Quebecois have remained roughly the same as last month. However, they are still not polling high enough to regain official party status (12 seats are required to receive official party status).

6. Others: 2.1% (-0.4 pp): Other parties and independents currently have about 2% of the vote. 

 Regional Model

Now let's look at the numbers a bit closer, region-by-region. Note however, that there are some discrepancies between the regional and national model. Some polling firms, such as Nanos or Ipsos Reid, do not include full regional data. Also, some parties have very strong support in some provinces, so there is some regional variation. Furthermore, the regional sample sizes are small, so the margin of error can be as high as +/- 10%.

The numbers below are based on cube rule regional models. Cube rule works better for the regional level, while square rule is better nationally. This is probably because most regions are a two-way race, while nationally there are multiple parties with a chance of winning. Differences between the May and April numbers are included (percentage point change, seat change).

Atlantic

LPC: 36.3%, 18 seats (-8.8 pp, -8)
CPC: 28.7%, 9 seats (+ 5.7 pp, 6)
NDP: 24.6 %, 5 seats (+ 3.1 pp, 2)
GPC: 7.8%, 0 seats (+ 0.3 pp, 0)
Others: 2.6%, 0 seats (+ 0.2 pp, 0)

The Liberals have experienced quite a drop in the Atlantic with the Conservatives and NDP picking up the lost seats. It will be interesting to see if Peter MacKay's resignation while affect the Conservatives' polling in June. 

Quebec

NDP: 32.9%, 45 seats (+6.1 pp, 16)
LPC: 24.4%, 19 seats (-0.8 pp, -4)
CPC: 17.9%, 7 seats (-4.3 pp, -9)
BQ: 17.3%, 7 seats (-1.2 pp, -3)
GPC: 5.2%, 0 seats (0 pp, 0)
Others: 2.4%, 0 seats (0 pp, 0)

The NDP's biggest gains this month have come from Quebec. The party has now surged into a comfortable lead. The Conservatives had the greatest losses in this province. In early June, Gilles Duceppe announced that he would return to lead the Bloc Quebecois. Will the Bloc's numbers go back up? We'll have to wait to see.


Ontario

CPC: 36%, 62 seats (-1 pp, -4)
LPC: 32.4%, 45 seats (+ 0.1 pp, 1)
NDP: 21.9%, 14 seats (+1.8  pp, 3)
GPC: 7%, 0 seats (-0.4 pp, 0)
Others: 2.7%, 0 seats (-0.5 pp, 0)

There have not been any major changes in Ontario. The Conservatives have lost a few seats, while the Liberals and New Democrats have gained a couple. Ontario is the only province where the Liberals have gained a seat this month. 

Manitoba and Saskatchewan

CPC: 41%, 19 seats (+0.5 pp, 1)
LPC: 26.1%, 5 seats (-3.5 pp, -2)
NDP: 25.1%, 4 seats (+3.9 pp, 1)
GPC: 5.5%, 0 seats (-1.1 pp, 0)
Others: 2.3%, 0 seats (+ 0.2 pp, 0)

Manitoba and Saskatchewan are also pretty static at the moment. Only minor seat changes have taken place. The Conservatives still hold a comfortable lead. 

Alberta

CPC: 45.5%, 27 seats (+2.6 pp, 1)
NDP: 26.4%, 5 seats (+2.4 pp, 0)
LPC: 17.8%, 2 seats (-3.7 pp, -1)
GPC: 5.9%, 0 seats (-0.9 pp, 0)
Others: 4.5%, 0 seats (-0.3 pp, 0)

Did the Alberta provincial election affect the federal landscape? No. In fact, the Conservatives have gone up the most in Alberta this month. The NDP has increased their popular vote, but have not increased their seat count in Alberta. 

British Columbia

NDP: 29.6%, 16 seats (+5.4 pp, 8)
CPC: 28.1%, 13 seats (-3.3 pp, -6)
LPC: 26.5%, 11 seats (-1.2 pp, -2)
GPC: 13.5%, 2 seats (-0.8 pp, 0)
Others: 2.3%, 0 seats (-0.1 pp, 0)

British Columbia is a province where a lot has taken place this month. The NDP have risen by over 5 points and have gained 8 new seats. Both the Conservatives and Liberals have lost seats in this province. 

The Territories

CPC:  2 seats
LPC:  0 seats
NDP:  1 seats
GPC:  0 seats
Others: 0 seats

Note: There is no polling data in the territories, so I have to make the assumption that the incumbent wins. Since there are no polls, I cannot add any percentage figures either.

Canada

CPC:  139 seats (-11)
LPC:  100 seats (-16)
NDP:  90 seats (+30)
BQ: 7 seats (-3)
GPC:  2 seats (0)
Others: 0 seats (0)

The NDP have made huge gains this month increasing its popular vote in every region of the country. The Liberals have been the biggest losers, but the Conservatives and Bloc Quebecois have lost several seats as well. If an election were held today, the most probable outcome would be a Conservative minority government with the Liberal Party as the Official Opposition.


Monday, May 11, 2015

Canada Federal Election: April Polling Averages

The polling averages for the month of April (up to April 30) have been updated.


The graph below illustrates each party's polling average for each month. The parties are listed by popular vote rank, and in brackets the rank and percentage point change is given. Green means an increase, while red means a decrease. If nothing is written, then no change has taken place.


1. Conservatives: 32.7% (+0.3 pp). The Conservatives have had a small increase in their polling average and have maintained their lead over the Liberals for the second month in a row. The latest poll by Abacus Data, pegging the party at 36%, is their highest since January 2013.

2. Liberals: 29.8% (-0.7 pp). The Liberals are polling their lowest since Trudeau was elected leader. They have lost the lead over the Conservatives and their support is slowly declining.

3. NDP: 22.7% (+1.1 pp). The NDP have made the biggest improvement this month and have gone up nearly 3 points since the beginning of the year. Much of the NDP's gains can be attributed to the Liberal's losses.

4. Green Party: 7.9% (-0.3 pp). The Greens have experienced a very slight drop this month, but are still ahead of the Bloc Quebecois. However, they are polling quite well now. The EKOS poll from April 28 gave them 9.9%. The question now is whether those who say that they intend to vote Green will actually do so.

5. Bloc Quebecois: 4.4% (-0.6 pp). The Bloc Quebecois have also experienced a dip this month. However, most polls consistently put the Bloc Quebecois at 4 or 5 percent.

6. Others: 2.5% (+0.2 pp). Other parties and independents are polling just about the same today as they were last month.

Regional Model

I am working on a regional model. It works just like the national model, but for each of Canada's main regions.

Atlantic

LPC: 45.1%, 26 seats
CPC: 23%, 3 seats
NDP: 21.5 %, 3 seats
GPC: 7.5%, 0 seats
Others: 2.8%, 0 seats

Quebec

NDP: 26.8%, 29 seats
LPC: 24.8%, 23 seats
CPC: 22.2%, 16 seats
BQ: 18.5%, 10 seats
GPC: 5.2%, 0 seats
Others: 2.4%, 0 seats

Ontario

CPC: 37%, 66 seats
LPC: 32.3%, 44 seats
NDP: 20.1%, 11 seats
GPC: 7.4%, 0 seats
Others: 3.2%, 0 seats

Manitoba and Saskatchewan

CPC: 40.5%, 18 seats
LPC: 29.6%, 7 seats
NDP: 21.2%, 3 seats
GPC: 6.6%, 0 seats
Others: 2.1%, 0 seats

Alberta

CPC: 42.9%, 26 seats
NDP: 24%, 5 seats
LPC: 21.5%, 3 seats
GPC: 6.8%, 0 seats
Others: 4.8%, 0 seats

British Columbia


CPC: 31.4%, 19 seats
LPC: 27.7%, 13 seats
NDP: 24.2%, 8 seats
GPC: 14.3%, 2 seats
Others: 2.4%, 0 seats

The Territories

CPC:  2 seats
LPC:  0 seats
NDP:  1 seats
GPC:  0 seats
Others: 0 seats
Note: There is no polling data in the territories, so I have to make the assumption that the incumbent wins. Since there are no polls, I cannot add any percentage figures either.

Canada

CPC:  150 seats
LPC:  116 seats
NDP:  60 seats
BQ: 10 seats
GPC:  2 seats
Others: 0 seats

This regional aggregate gives the Conservatives and Bloc Quebecois more seats and the NDP and Green Party less seats. This is because of regional concentrations of voting habits. Also note that this model uses the cube rule instead of the square rule. During the 2011 Canadian federal election, the cube rule was more accurate on the regional level (the square rule was better on the national level).


Monday, April 20, 2015

Canada Election 2015 Projection

The projection for the 2015 Canadian federal election has been updated. 


A change has been applied to the model. Instead of determining the percentage for independents and other parties after weighting, the percentages for these parties are calculated beforehand and are weighted just the same as for the rest of the parties.

I am also currently working on a model were regional polls are considered. However, I have tested it using results from the 2011 Canadian federal election and I am not very satisfied with it: the national popular vote square rule model that is used now works much better.


Tuesday, April 07, 2015

Canada Federal Election 2015 Projection

Above: Current projection for the 2015 Canadian federal election as of March 31, 2015.

The graph below shows the polling averages up to March 2015. Month 1 means January, 2 means February, and so on.


Conservatives: The Tories have dropped by 0.6 percentage points since February, but their decline has been less severe than that of the Liberals, so they have taken the lead.

Liberals: The Liberals have experienced a fall of 2.7% since January and have been overtaken by the Conservatives.

NDP: The NDP have increased from 21.3% in February to 22.7% in March, but there is still a big difference between them and second place.

Green Party: The Greens have separated themselves from the Bloc Quebecois and rose by 1.7 percentage points.

Bloc Quebecois: The Bloc have been quite consistent and are generally polling under 5%.

Others: Other parties and independents currently have 0% of the vote.

Methodology

In order to determine the percentage for each party, the last ten national polls are taken. Polls are weighted based on recency and sample size. Then a weighted average is taken. Pollster bias (the house effect) is not included in this model. I am currently working on this.

Only national polls are considered for the seat projection model, so this part of the projection is less accurate. The method I use is based on the cube rule. I call it the square rule. The percentage of seats each party receives is equal to the popular vote percentage for that party squared divided by the sum of the squares of all the parties. If this method is applied to the popular vote percentage for the 2011 Canadian federal election, the Conservatives would receive 166 seats, the exact same amount they won. The square rule method also gave the correct number of seats for the Bloc and the Greens, and was off by only four for the Liberals and NDP.

Cube rule is more accurate for a two-party system, such as in the United States and in a multi-party system like in Canada, it overestimates the winner's seats and underestimates those who had much less of the popular vote. I have considered basing the model on regional polls, but pollsters are inconsistent with this and the sample size is much smaller leading to a high margin of error. Some poll aggregators use a regional swing model and apply changes to each riding. The problem with this is that it takes a lot of time, it does not always take into account local factors in that riding, and the seats were redistributed from 308 to 338 seats in 2012 so all the 2011 results in each riding would have to be re-aggregated.


The polling aggregation methodology used will be further discussed in an upcoming post.

Here are some other very good Canadian poll aggregation websites:

http://www.threehundredeight.com/

http://www.lispop.ca/seatprojections.html

http://lispop.ca/elections/fed2015.html

 On the American side, here are some more:


http://www.realclearpolitics.com/elections/2016/

http://fivethirtyeight.com/


Sunday, April 05, 2015

The Outlier Poll: Part Two

A few days ago, I wrote a post titled "EKOS Poll: Outlier or New Trend?" (http://logbook2015.blogspot.ca/2015/04/blog-post_7.html) which discussed a recent poll that showed the Liberals polling under 29%, a figure not achieved since June 2013. However, EKOS released a new poll less than a week later pegging the Conservatives at 31.9% and the Liberals at 27.6%. Liberals have not polled that low since the spring of 2013. A Forum Research poll was released the same day which had the Liberals leading the Conservatives 34% to 31%. The Conservatives' numbers were close, but there is a difference of six percentage points for the Liberals. So are these EKOS polls outliers?

I looked up all the polls from 2015 and did some analysis. I found the mean, median, standard deviation, Q1, and Q3. Mean is the average and standard deviation measures on average how far a data point is from the mean. Population standard deviation is for larger sets of data, while sample deviation is for less data points, with more room for error. Q1 is the first quartile and represents the 25th percentile for the data (the bottom 25%). Q3 is the third quartile and is the cutoff for 75% of the data. The median, or middle number, is sometimes known as Q2. This diagram gives an illustration of the quartiles:

It's a bit like cutting a rectangle into equal four pieces: each cut represents a quartile

The interquartile range, or IQR, is the difference between Q3 and Q1 and represents the middle 50% of the data. The following equation can be used to find outliers:

x is not an outlier if x belongs to the set [ Q1 - 1.5IQR , Q3 + 1.5IQR ]

Applying this formula to the polling data for the Liberals tells us that the poll is not an outlier if the percentage is from 30.25% to 35.35%, all inclusive. So polls outside this range interval would be considered outliers. Hence, we have 5 outliers. Three of them are earlier Forum polls that give the Liberals 36%, 37%, and 39%. We also have the two EKOS polls which have the Liberals at 28.5% and 27.6%. 

If the distribution of polls is normal, probabilities can be calculated using z-scores. The following equation is used to test for skewness.

Pearson's Index (PI) = 3(mean-median)/sample standard deviation

If |PI| is less than 1, the data is not significantly skewed. For our data we got PI = -0.04, so there is hardly any skewness. We can now go ahead and find probabilities.

Since the distribution is normal, z-scores can be used to find probabilities. z-scores measure how many standard deviations a data point is from the mean. The below formula is used:

z-score = (data point x - mean)/population standard deviation.

z-scores can be converted into probabilities using tables. So using this method we find the following probabilities:

Greater than 35%: 22%
Greater than 36%: 12%
Greater than 39%: 2%
Less than 29%: 5%
Less than 28%: 2%

The below histogram gives a visual. All of the outliers are located on the tails. They are all very unlikely to occur.

So mathematically, these polls are outliers. However, the assumption that is being made here is that nothing really changed from January to March, so the date the poll was taken doesn't matter. But it does. So let's take a look at 2015 polls for the Liberals over time.

The below graph illustrates all of the 2015 polls. There is a small downward trend, but a linear fit is very poor with a low R-squared value due to all the fluctuation.


A 5-poll moving average looks better, but it is still quite jagged.

Here is a line graph showing all 2015 EKOS polls for the Liberals:


The downward trend is far more obvious here and there is a fairly high R-squared value and a high R value implying a strong correlation (R is the correlation coefficient, while R-squared is just for the fit).

Now let's take a look at Forum's polls.

The R-squared value is very low despite a small negative correlation, but there are not as many data points here so we much be cautious before jumping to conclusions.

This has been a rather lengthy analysis, but we can learn that the EKOS poll may not be an outlier after all. It is definitely on the lower end of the spectrum and there may have been some unintentional bias in play (this will be analyzed in a future post), but since the Liberals are currently sliding downwards in most polls and because EKOS surveyed 4000 people in each poll with a small margin of error, these are not freak polls and probably do represent the current political landscape. We cannot jump to any conclusions, such as this being because of the Liberals' support for Bill C-51, but we do know that the Liberals no longer maintain the huge lead they held over the Tories only a few months ago.


Wednesday, April 01, 2015

EKOS Poll: Outlier or a New Trend?

A poll for the 2015 Canadian federal election published by EKOS a few days ago seems very out of place. According to the poll, the Conservatives are in the lead with only 31.8%. The Liberals are in second at 28.5% with the NDP in third place with 23.2%. The Green Party and the Bloc Quebecois trail at 8.7% and 4.7% respectively.

The poll shows low numbers for the Tories, but more so for the Liberals. Trudeau and his party have never polled lower than 30% since September 2013, one and a half years ago. While EKOS displays lower numbers than most polling firms do (the most recent Abacus poll shows the Liberals at 34% and the Conservatives at 33%), the question is if this poll is just an outlier and should be ignored.

While I think that this poll is very likely an outlier due to its low numbers and the Abacus poll showing a far different picture, it does show that the Liberals need to improve their numbers if they intend to replace Harper. Since the fall of 2014, the Liberals have been on a decline. Other than the polls by Forum, they have not managed to poll higher than 35%.

The Conservatives are first in this poll, but they should worry as well. In several recent polls, Conservatives seem to have lost some of their forward momentum and their polling numbers are declining (but less rapidly than for the Liberals). 

This EKOS poll is good news for Thomas Mulcair. This has been the NDP's best poll since late January 2015 and shows the NDP gaining ground. 

The Greens are also polling at high levels, but EKOS seems to be the only polling firm so far that is giving the Green Party over 7%, possibly due the house effect and how EKOS' polls are conducted.

The Bloc Quebecois are in fifth with 4.7% and have remained mostly stable so far.

4311 Canadians were polled using Interactive Voice Response (IVR) with a margin of error of ±1.5 pp.

The question of whether or not this poll is an outlier will hopefully be answered when the next EKOS poll comes out this Friday.