Friday, April 24, 2015

Spencer Gorge/Webster's Falls Conservation Area

Spencer's Gorge/Webster's Falls Conservation Area is a great place to visit if you want to see waterfalls, go hiking, and enjoy some scenic lookouts. Located on the Niagara escarpment, it is a short drive from Hamilton, Ontario. Within the park, four waterfalls can be visited and I will mainly discuss those. 

All pictures were taken by me or by people I was with, and are from my 2008 and 2012 summer visits. People have been cropped out for some of the pictures to protect their privacy.

I will describe my 2012 visit in detail (in 2008 I visited fewer places).

Tews Falls, a 41 m high waterfall, just 11 metres short of Niagara Falls is a short walk from the parking lot (note that there is a second parking lot near Webster's Falls). It is plunge waterfall, 9 m wide. There are two platforms where you see a side-view of the waterfall. This is where most pictures of Tews Falls are taken. You can't go very close to the top of the falls, since there are fences and guardrails for safety reasons. There is a small stream that feeds the falls (Logie's Creek), but it largely obstructed by trees, bushes, and undergrowth. However, the view is still great.

View of Tews Falls. Photo taken during my 2008 visit.

From here you can take the short-cut to Webster's Falls by going west then south along the Webster's Falls Side Trail or you can catch some other sights around the park by taking the trail east then south, then returning to Tews Falls and heading west to Webster's Falls. This is what I did in 2008, but my 2012 trip was a bit more adventurous.

I headed east. There's some hiking involved here, but it is not too difficult. Along the way, you will see an old abandoned mine. It is just 3 metres long and at most 2 metres deep. It is perfectly safe to go inside. You may want to bring a flashlight, but there is not much to see, since the mine has been filled in. There are also some metal pieces of an old shack nearby. Stop by Dundas Peak as well where you can see some incredible views of the conservation area and the city of Hamilton, the "waterfall capital of the world" (there are actually nearly one-hundred waterfalls in the vicinity of Hamilton).

Afterwards the trail converges onto Highway 8 and from there you can get to the Bruce Trail. However, that is outside of the park, so you may want to go back to Tews Falls and then take the trail west to Webster's Falls, like what I did in 2008.

Back in 2008, from the platform overlooking Tews Falls, I saw some people down at the base of the falls. I wondered how they got there, since it is nearly impossible to directly climb down the steep basin. So for my 2012 trip, I made it a goal to go to the base of Tews Falls.

I hiked east down the Webster's Falls Side Trail, as I previously mentioned. At the end of the trail there are railroad tracks. Follow the tracks west until you see an opening in the woods near Spencer's Creek. See map 2. There's actually a smaller 6 m high waterfall called Dundas Falls on the other side of the tracks (outside of the park), but I did not go there. I headed north, always beside Spencer's Creek. 

Map 1. This map gives a general look of the Spencer Gorge/Webster's Falls Conservation Area.

Map 2. This map shows where to go from the Webster's Falls Side Trail to the point from where one can ultimately get to the base of Tews Falls. 

Often, there is no formal trail, but walking is not too difficult beside the river. Also, people have walked here previously, so a "natural" trail has formed. You may have to cross the stream once or twice, but it is easy, since the water is shallow and there are plenty of stones to help you in crossing. You may get your shoes wet and muddy if you're not careful, though.

About halfway, there's a fork in the road. The river goes west and north. North will take you to Tews Falls and west will take you to Webster's Falls. Intending to visit Tews Falls first, I continued north.

Shortly after the fork is Lower Tews Falls. You cannot access these falls or the base of Tews Falls from the Spencer Creek Side Trail. Hence, few park visitors see these great features of the Spencer Gorge. Lower Tews Falls is a curtain waterfall, 12 m high and 22 m wide. 

View of Lower Tews Falls during approach. 

 As the person removed in this photo has done, one can stand right beside the falls. Don't worry. It's completely safe. The water flow rate is low and there's no water on that rock.

Afterwards we continued on, always beside the river. The gorge becomes narrower here, so you may have to occasionally hold onto branches to avoid walking into muddy terrain and staying stable and dry. 

Finally, partially obstructed by trees and green undergrowth, I saw it. Tews Falls. Like an explorer in the Amazon gazing at something new and amazing for the first time, I approached the falls. Going the base of falls and seeing the waterfall up close is so much better than just looking at it from a distance.

 Approaching the base of Tews Falls.


 View of Tews Falls from the base. There is much less water during the summer, especially in August.


 Close-up view of the waterfall. You can easily go behind the falls and even take a shower directly under the waterfall. The cool water is very refreshing on a hot summer day.

 After that, we headed back down the river and now went west on Spencer's Creek towards Webster's Falls. Eventually, you get to a portion of the Spencer's Creek Side Trail. This trail takes you to Webster's Falls. However, it's still not a walk in the park. I recall a difficult portion of the trail in 2008 where the path got very narrow and inclined, so we had to hold onto a rope pre-installed on the trail. But in 2012, there was no longer a rope, probably because the trail got repaired a bit. 

Eventually you can hear the roar of Webster's Falls, then it appears from the distance. Most people just continue straight ahead and miss another waterfall: Baby Webster's Falls. This waterfall is located just downstream of the waterfall. If you look west right beside a stairway leading to the top of Webster's Falls, you can see it. Baby Webster's Falls is a complex ribbon waterfall. It is 20 m high and 3 m wide. Usually, there is not much water flowing down and it is being fed by a smaller tributary of Spencer's Creek.

Baby Webster's Falls. On a dry day, there is very little water. 

Finally, I visited Webster's Falls, arguably the most popular and famous waterfall in the Hamilton Area. It is a 22 m high and 30 m wide curtain/plunge waterfall. You can view the falls from almost all angles. You can climb up the stairwell to view the waterfall from the top, stand just a few metres from the edge and look down, cross Spencer's Creek via two cobblestone footbridges, and enjoy the park above the waterfall. It is even possible to go behind Webster's Falls. I recommend you do this one a day in the summer when it is dry and the water flow is low. Still, this is not easy and may be dangerous. The ground is slippery and it is hard to find a place to hold onto, especially because of the clay ledges.

 Webster's Falls (2008). 


Webster's Falls (2012). There was much less water than last time. 


 At the base of the falls.


 Behind the waterfall. The walkway is very muddy, slippery, and wet. It is also on an incline. There is not much to hold onto. Be very careful.


 Right behind Webster's Falls. It is very rocky at the bottom, so I do not recommend attempting to go over the falls in a barrel.


 More views from behind Webster's Falls.

All in all, Spencer Gorge/Webster's Falls Conservation Area is great place to see waterfalls and be outdoors. There is a lot to discover and adventure awaits at every corner.

For more information, directions, and maps visit:

http://www.conservationhamilton.ca/spencer-gorge-websters-falls-conservation-area


Rubio Now In Third Place, Warren Overtakes Biden

FOX News has released a new poll for the presidential nomination race. Marco Rubio takes the lead once again with 13%. Scott Walker is close behind at 12%. Rand Paul placed third with 10% and Jeb Bush and Mike Huckabee each received 9%. Ted Cruz polled at 8%. 

Hillary Clinton still leads the Democrats with 62%. Elizabeth Warren is the runner-up with 12% and the FOX News poll gave Joe Biden 9%.

The polling averages have been updated.

Republican Nomination

1. Jeb Bush: 14.1%
2. Scott Walker: 13.2%
3. Marco Rubio: 9.7% (+2)
4. Ted Cruz: 9.2% (-1)
5. Rand Paul: 9.0% (-1)
6. Mike Huckabee: 8.5% 
7. Ben Carson: 6.5% 
8. Chris Christie: 5.5%
9. Rick Perry: 2.9%
10. Rick Santorum: 1.8%
11. John Kasich: 1.6%
12. Bobby Jindal: 1.3% 
 
Rubio is now ahead of Cruz and Paul and is in third place. There has clearly been a loss of support for the front-runners, Bush and Walker, ever since Rubio, Cruz, and Paul launched their campaigns.

Democratic Nomination
 
1. Hillary Clinton: 59.9%
2. Elizabeth Warren: 12.1%
3. Joe Biden: 11.4% 
4. Bernie Sanders: 4.2%
5. Martin O'Malley: 1.3% 
6. Jim Webb: 1.1%
 
The Democratic field is much more static and much less competitive than the Republican field. Everyone has polled quite consistently so far. However, Warren has managed to overtake Biden and O'Malley and Webb are no longer tied. 


Thursday, April 23, 2015

Rubio Leads in Quinnipiac Poll

A recent opinion poll released by Quinnipiac University shows Marco Rubio in the lead for the first time, with 15%. Jeb Bush is in second with 13%, Scott Walker is third with 11%, Ted Cruz is fourth with 9%, and Rand Paul is fifth with 8%. This is another poor poll for Dr. Ben Carson, who received only 3%. Meanwhile, New Jersey governor Chris Christie polled well with 7%.

The polling averages for the Republicans have been updated and can be seen below.

Republican Nomination

1. Jeb Bush: 15.3%
2. Scott Walker: 13.6%
3. Ted Cruz: 9.3%
4. Rand Paul: 8.7% 
5. Marco Rubio: 8.7% (+2)
6. Mike Huckabee: 8.4% (-1)
7. Ben Carson: 6.8% (-1)
8. Chris Christie: 5.5%
9. Rick Perry: 3.1%
10. Rick Santorum: 1.9%
11. John Kasich: 1.5% (+1)
12. Bobby Jindal: 1.4% (-1)
 
 Just like what Ted Cruz and Rand Paul have previously done, Rubio has leapfrogged over Huckabee and Carson and is tied with Paul in fourth place (but Paul is ahead by less than one-tenth of a percentage point). Jeb Bush maintains his lead and the gap between him and Scott Walker has increased. Both of these candidates' numbers are decreasing, but the decrease seems bigger for Walker. Carson's average has dropped again and he finds himself at under 7%. John Kasich has overtaken Bobby Jindal, but Santorum, Kasich, and Jindal are all within striking distance of each other.
 

Monday, April 20, 2015

Canada Election 2015 Projection

The projection for the 2015 Canadian federal election has been updated. 


A change has been applied to the model. Instead of determining the percentage for independents and other parties after weighting, the percentages for these parties are calculated beforehand and are weighted just the same as for the rest of the parties.

I am also currently working on a model were regional polls are considered. However, I have tested it using results from the 2011 Canadian federal election and I am not very satisfied with it: the national popular vote square rule model that is used now works much better.


Paul and Rubio Jump Forward In New Poll

A CNN/ORC poll has been released today, surveying Republicans and Democrats from April 16 to April 19. Jeb Bush is still in the lead in the GOP field with 17%, Scott Walker is at 12%, and Rand Paul and Marco Rubio are tied for third, each with 11%.

The polling averages have been updated. Changes in position (rank) are indicated by green for an increase, red for a decrease, and nothing if the candidate's position remains unchanged.

GOP

1. Jeb Bush: 15.9%
2. Scott Walker: 14.4%
3. Ted Cruz: 9.2%
4. Rand Paul: 8.8% (+2)
5. Mike Huckabee: 8.7%
6. Ben Carson: 7.9% (-2)
7. Marco Rubio: 7.1%
8. Chris Christie: 5.3%
9. Rick Perry: 3.1%
10. Rick Santorum: 1.9%
11. Bobby Jindal: 1.6%
12. John Kasich: 1.4%

Bush has increased his lead over Walker by a bit, but both of them have dropped slightly since the last polling average. Rand Paul has jumped up to fourth place, while Ben Carson fell to sixth after the CNN/ORC poll gave him only 4%. Marco Rubio is now polling over 7%, while Christie continues to perform poorly.

Democratic Party (updated and edited polling average as of March 31, 2015)

1. Hillary Clinton: 59.3%
2. Elizabeth Warren: 12.1% (+1)
3. Joe Biden: 12.1% (-1)
4. Bernie Sanders: 4.2%
5. Martin O'Malley: 1.3% 
6. Jim Webb: 1.3%


Warren is tied with Biden, but leads if a second decimal place is taken into account.  Martin O'Malley is in a virtual tie with Jim Webb (though the Maryland governor leads by less than one tenth of a percentage point).

For the Republican candidates, the post-announcement bump has been smaller than predicted in my previous posts (http://logbook2015.blogspot.ca/2015/04/declaring-candidacy-and-polls.html, http://logbook2015.blogspot.ca/2015/04/more-announcements.html). I predicted that Paul would score between 15% to 17% with a polling average from 11.6% to 12.6%, but in reality, Paul's numbers fell short of this range. The CNN/ORC poll put him at 11% and his current average is 8.8%. However, he has overtaken Carson and Huckabee as predicted. The same poll gave Rubio 11% as well and his average is 7.1%. The prediction also fell short for him as result of 13% to 15% and a polling average of 9.5% to 10.5% was predicted. A likely explanation for these shortcomings may have been that the bump after declaration of candidacy is not a constant value and varies for different candidates. Also, the only known data point was Ted Cruz, so all predictions were made for his result. Furthermore, CNN/ORC was not a polling firm in the prediction and since methodology varies between pollsters, these predictions may work best for the same polling firm. With my model, a new poll does not drastically effect the current standings, so big changes do not occur suddenly. We will see more trends emerging after new polls are released and the model is updated.

Now with this new poll and many more to come, I will be able to make more accurate predictions for upcoming presidential announcements. Ben Carson has stated that he will make his declaration on May 4 and Mike Huckabee has hinted at a May 5 campaign launch, so stay tuned for more!


Tuesday, April 14, 2015

More Announcements

On Sunday Hillary Clinton and Marco Rubio announced that they will be running for president. Just like in a previous post on Rand Paul's announcement (http://logbook2015.blogspot.ca/2015/04/declaring-candidacy-and-polls.html), I will attempt to predict what their polling numbers will be after announcing a White House run. The assumption being made is that there is a linear, constant bump in polling numbers occurs after declaring candidacy.

In the previous post, "Declaring Candidacy and Polls", we saw an increase of +7 pp for Ted Cruz in the newest polls, and an increase in his polling average of 3.3 pp to 4.3 pp. Hillary Clinton is currently polling at 59.3%, so applying this boost, her polling average would become 62.6% to 63.6%. Her huge lead would become even bigger.

Here are Clinton's most recent polls:

ABC/Washington Post (3/26-3/29): 66%
Public Policy Polling (3/26-3/31): 54%
Fox News (3/29-3/31): 61%

Using the methodology above, Clinton would receive between 61% to 73% in a future poll.

Now let's go to Marco Rubio. 

Rubio experienced an increase of about +1.5 pp in March and his most recent polling average is 6.2%. Applying the post-announcement boost, his polling average would be 9.5% to 10.5%. This would place him above Huckabee, Carson, and Cruz, and close behind Rand Paul (who also got a boost).

Rubio's most recent polls are found below:

ABC/Washington Post (3/26-3/29): 8%
Public Policy Polling (3/26-3/31): 6%
Fox News (3/29-3/31): 8%

Hence, in a future poll, Rubio may receive between 13% to 15%, making him a front-runner or almost one. 

However, several assumptions are being made in these predictions, and we can only know for sure once the next couple of polls are released.


Friday, April 10, 2015

Presidential Primaries Polling Averages Update

 Republican Nomination

The GOP presidential primaries polling averages have been updated with the addition of a poll by Monmouth University that shows Jeb Bush leading with 13% and Scott Walker and Ted Cruz close behind both at 11%. Below is the current list. Changes in position (rank) are indicated by green for an increase, red for a decrease, and nothing if the candidate's position remains unchanged.

1. Jeb Bush: 15.7%
2. Scott Walker: 15%
3. Ted Cruz: 9.3% (+3)
4. Ben Carson: 8.9% (-1)
5. Mike Huckabee: 8.8% (-1)
6. Rand Paul: 8.3% (-1)
7. Marco Rubio: 6.2%
8. Chris Christie: 5.7%
9. Rick Perry: 3.1%
10. Rick Santorum: 1.6%
11. Bobby Jindal: 1.5%
12. John Kasich: 1.3%

The biggest mover right now is Ted Cruz who has jumped up to third place after declaring candidacy. Also noteworthy is that Rick Perry's numbers have increased by 0.5 percentage points since the last update. The Monmouth poll gave him 5%, a number he has not achieved since January. Perry may not be spiraling downwards after all. 

Democratic Nomination

  Fox News released an opinion poll for the Democratic primary. Hillary Clinton is still in the lead with 61%. Below is the current list. Changes in position (rank) are indicated by green for an increase, red for a decrease, and nothing if the candidate's position remains unchanged.

1. Hillary Clinton: 59.3%
2. Joe Biden: 12.2%
3. Elizabeth Warren: 12%
4. Bernie Sanders: 4.2%
5. Martin O'Malley: 1.3% (+1)
6. Jim Webb: 1.3% (-1)

Warren is now only 0.2pp behind the vice-president, so they are statistically tied in second place. Martin O'Malley has entered into a virtual tie with Jim Webb (though he leads by 0.02pp).
This means a small increase for O'Malley who was polling at 1% at the end of March. 


Declaring Candidacy and Polls

A couple of weeks ago Ted Cruz announced his White House run and almost immediately, his polling numbers went up. A few days ago Rand Paul became the second major Republican candidate to declare his candidacy. What will his upcoming polling numbers look like?

First let's take a look at Ted Cruz's most recent numbers.

ABC/Washington Post (3/26-3/29): 12%
Public Policy Polling (3/26-3/31): 16%
Fox News (3/29-3/31): 10%
Monmouth University (3/30-4/2/15): 11%

Note that Cruz announced his candidacy on March 23, so none of the polls were already in the field beforehand.

Here are the second most recent polls for each of these polling firms (Monmouth has not done any before):

ABC/Washington Post (12/11-12/14): 8%
Public Policy Polling (2/20-2/22): 5%
Fox News (1/25-1/27): 4%

Since most polling firms have different polling methodologies, we will compare Cruz's polling numbers by firm.

ABC/Washington Post: +4pp
Public Policy Polling: +11pp
Fox News: +6pp

Note that pp means percentage points (difference between percentages).

If we take a raw average of the percentage points, we get +7pp.

Now let's take a look at Rand Paul's numbers.

ABC/Washington Post (3/26-3/29): 8%
Public Policy Polling (3/26-3/31): 10%
Fox News (3/29-3/31): 9%

If we translate Cruz's percentage point increase to Rand Paul for a future poll, Paul would score between 15% to 17% (raw average 16%), making him a front-runner for that poll.

How would Paul's polling average change? First, let's go back to Cruz.

January: 5.3%
February: 5%
March: 8.6%
April: 9.3%

The ABC/Washington Post, PPP, and Fox News polls took place in March and April's average includes the Monmouth poll as well as the former three polls (and six other older polls). Since Cruz declared candidacy in the third week of March, both March and April include high polling percentages. So if we compare his averages in January and February, and the March and April figures, we see an increase of 3.3pp to 4.3pp.

Paul's latest polling average is 8.3%. If we translate Cruz's percentage point increase to Paul, the Kentucky senator's average is bumped up to 11.6% to 12.6%. This would place him above Cruz (9.3%) and approaching Walker and Bush (15% and 15.7% respectively). The margin may become even smaller if the front-runners' numbers go down as a result of Paul's announcement. This is unlikely in the case of Walker and Bush, since they are more establishment candidates than the grassroots Paul, but Paul might attract some libertarian-leaning voters on Cruz's side.

This is all speculation, of course, and we can only know for sure when the next poll is released.


Tuesday, April 07, 2015

Canada Federal Election 2015 Projection

Above: Current projection for the 2015 Canadian federal election as of March 31, 2015.

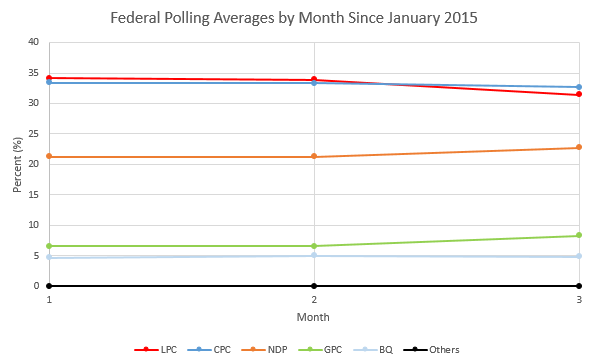
The graph below shows the polling averages up to March 2015. Month 1 means January, 2 means February, and so on.


Conservatives: The Tories have dropped by 0.6 percentage points since February, but their decline has been less severe than that of the Liberals, so they have taken the lead.

Liberals: The Liberals have experienced a fall of 2.7% since January and have been overtaken by the Conservatives.

NDP: The NDP have increased from 21.3% in February to 22.7% in March, but there is still a big difference between them and second place.

Green Party: The Greens have separated themselves from the Bloc Quebecois and rose by 1.7 percentage points.

Bloc Quebecois: The Bloc have been quite consistent and are generally polling under 5%.

Others: Other parties and independents currently have 0% of the vote.

Methodology

In order to determine the percentage for each party, the last ten national polls are taken. Polls are weighted based on recency and sample size. Then a weighted average is taken. Pollster bias (the house effect) is not included in this model. I am currently working on this.

Only national polls are considered for the seat projection model, so this part of the projection is less accurate. The method I use is based on the cube rule. I call it the square rule. The percentage of seats each party receives is equal to the popular vote percentage for that party squared divided by the sum of the squares of all the parties. If this method is applied to the popular vote percentage for the 2011 Canadian federal election, the Conservatives would receive 166 seats, the exact same amount they won. The square rule method also gave the correct number of seats for the Bloc and the Greens, and was off by only four for the Liberals and NDP.

Cube rule is more accurate for a two-party system, such as in the United States and in a multi-party system like in Canada, it overestimates the winner's seats and underestimates those who had much less of the popular vote. I have considered basing the model on regional polls, but pollsters are inconsistent with this and the sample size is much smaller leading to a high margin of error. Some poll aggregators use a regional swing model and apply changes to each riding. The problem with this is that it takes a lot of time, it does not always take into account local factors in that riding, and the seats were redistributed from 308 to 338 seats in 2012 so all the 2011 results in each riding would have to be re-aggregated.


The polling aggregation methodology used will be further discussed in an upcoming post.

Here are some other very good Canadian poll aggregation websites:

http://www.threehundredeight.com/

http://www.lispop.ca/seatprojections.html

http://lispop.ca/elections/fed2015.html

 On the American side, here are some more:


http://www.realclearpolitics.com/elections/2016/

http://fivethirtyeight.com/


Sunday, April 05, 2015

The Outlier Poll: Part Two

A few days ago, I wrote a post titled "EKOS Poll: Outlier or New Trend?" (http://logbook2015.blogspot.ca/2015/04/blog-post_7.html) which discussed a recent poll that showed the Liberals polling under 29%, a figure not achieved since June 2013. However, EKOS released a new poll less than a week later pegging the Conservatives at 31.9% and the Liberals at 27.6%. Liberals have not polled that low since the spring of 2013. A Forum Research poll was released the same day which had the Liberals leading the Conservatives 34% to 31%. The Conservatives' numbers were close, but there is a difference of six percentage points for the Liberals. So are these EKOS polls outliers?

I looked up all the polls from 2015 and did some analysis. I found the mean, median, standard deviation, Q1, and Q3. Mean is the average and standard deviation measures on average how far a data point is from the mean. Population standard deviation is for larger sets of data, while sample deviation is for less data points, with more room for error. Q1 is the first quartile and represents the 25th percentile for the data (the bottom 25%). Q3 is the third quartile and is the cutoff for 75% of the data. The median, or middle number, is sometimes known as Q2. This diagram gives an illustration of the quartiles:

It's a bit like cutting a rectangle into equal four pieces: each cut represents a quartile

The interquartile range, or IQR, is the difference between Q3 and Q1 and represents the middle 50% of the data. The following equation can be used to find outliers:

x is not an outlier if x belongs to the set [ Q1 - 1.5IQR , Q3 + 1.5IQR ]

Applying this formula to the polling data for the Liberals tells us that the poll is not an outlier if the percentage is from 30.25% to 35.35%, all inclusive. So polls outside this range interval would be considered outliers. Hence, we have 5 outliers. Three of them are earlier Forum polls that give the Liberals 36%, 37%, and 39%. We also have the two EKOS polls which have the Liberals at 28.5% and 27.6%. 

If the distribution of polls is normal, probabilities can be calculated using z-scores. The following equation is used to test for skewness.

Pearson's Index (PI) = 3(mean-median)/sample standard deviation

If |PI| is less than 1, the data is not significantly skewed. For our data we got PI = -0.04, so there is hardly any skewness. We can now go ahead and find probabilities.

Since the distribution is normal, z-scores can be used to find probabilities. z-scores measure how many standard deviations a data point is from the mean. The below formula is used:

z-score = (data point x - mean)/population standard deviation.

z-scores can be converted into probabilities using tables. So using this method we find the following probabilities:

Greater than 35%: 22%
Greater than 36%: 12%
Greater than 39%: 2%
Less than 29%: 5%
Less than 28%: 2%

The below histogram gives a visual. All of the outliers are located on the tails. They are all very unlikely to occur.

So mathematically, these polls are outliers. However, the assumption that is being made here is that nothing really changed from January to March, so the date the poll was taken doesn't matter. But it does. So let's take a look at 2015 polls for the Liberals over time.

The below graph illustrates all of the 2015 polls. There is a small downward trend, but a linear fit is very poor with a low R-squared value due to all the fluctuation.


A 5-poll moving average looks better, but it is still quite jagged.

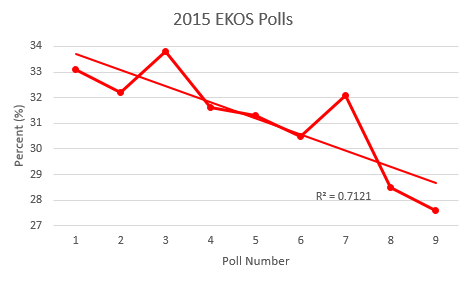
Here is a line graph showing all 2015 EKOS polls for the Liberals:


The downward trend is far more obvious here and there is a fairly high R-squared value and a high R value implying a strong correlation (R is the correlation coefficient, while R-squared is just for the fit).

Now let's take a look at Forum's polls.

The R-squared value is very low despite a small negative correlation, but there are not as many data points here so we much be cautious before jumping to conclusions.

This has been a rather lengthy analysis, but we can learn that the EKOS poll may not be an outlier after all. It is definitely on the lower end of the spectrum and there may have been some unintentional bias in play (this will be analyzed in a future post), but since the Liberals are currently sliding downwards in most polls and because EKOS surveyed 4000 people in each poll with a small margin of error, these are not freak polls and probably do represent the current political landscape. We cannot jump to any conclusions, such as this being because of the Liberals' support for Bill C-51, but we do know that the Liberals no longer maintain the huge lead they held over the Tories only a few months ago.


Wednesday, April 01, 2015

Forts Visited

  • Fort York
  • Fort Henry
  • Fort George
  • Fort Mississauga
  • Fort Niagara
  • Old Fort Erie
  • Quebec Citadel
  • Fort Drummond 
  • Butler's Barracks
Pictures and more information to come soon!

Waterfalls Seen


  • Niagara Falls
    • Horseshoe Falls
    • American Falls
    • Bridal Veil Falls
  • Spencer's Gorge (Hamilton)
    • Tew's Falls
    • Webster's Falls
    • Lower Tew's Falls
    • Baby Webster's Falls
  • Quebec
    • Montmorency Falls
  • Greater Toronto Area/Niagara Escarpment
    • Cataract Falls
    • Hilton Falls
  • Lake Superior (near Wawa)
    • Scenic High Falls
    • Silver Falls
  • Hungary
    • Lillafüred waterfall
Pictures and more information to come!

Ball Possession versus Goals Difference

I am currently doing some research on FIFA World Cup 2014 statistics and data. One relationship I investigated was ball possession versus goals difference. You might think higher ball possession equals more shots at goals equals more goals equals bigger goal difference. At least that's what I thought. But I was wrong.

The graph below shows ball possession (%) on the horizontal axis with goal difference on the vertical axis for the team with more ball possession during each game of the world cup. 

Simply put, there's no correlation between ball possession and goal difference. The data is very scattered. The best fit is quadratic with an R-squared value of 0.0272 meaning that the fit works for 2.72% of the data: useless for predicting anything.

However, the data is not completely useless. The team with the most ball possession had a negative goal difference twenty times meaning that these teams lost 20 out of 64 games (31%). A draw occurred 17 times (27%), and these teams won 27 times (42%). Note that overtime goals are excluded: only regular time is considered (includes injury time).

This is actually quite useful information. Greater ball possession means that the team has 69% chance of winning or tying a game, hence winning at least one point. They lose less than one third of the time.

The moral of the story? High ball possession won't necessarily give you a lot of goals, but it will increase your team's chance of winning the game.


Toronto Gas Prices

Since the big fall in gas prices during January 2015, gas prices have increased, but now they are beginning to slowly decrease again. These posts will display gas prices weekly. Only business days are included in graphs and weekend prices are interpolated.

The below graph shows gas prices so far since February 3, 2015.


Gas prices cannot be accurately extrapolated very far, so weekly and monthly trends will be analyzed instead.

The 100 Meter Sprint: What Can 2014 Tell Us About 2015?

2014 was probably not the most exciting year for the men's 100m sprint. There was no world championship or Olympics that year. Usain Bolt was out for most of the season after an ankle injury. Yohan Blake was absent due to a hamstring injury. Asafa Powell and Tyson Gay served drug bans for much of the year. Only Justin Gatlin made big headlines after winning the IAAF Diamond League and running with an impressive time and a personal best of 9.77s making him the fifth fastest human being of all time.

I graphed the best year times of over a dozen of the fastest 100m track sprinters currently active and then extrapolated. I chose a quadratic fit. It gave relatively good R-squared values meaning a close fit, and modelling a sprinter's progression over time seems to be parabolic: they start with a time of 10.3-ish, then progress further down maybe to 10, if they are good they can get a sub-10 time, let's say 9.9. But after reaching that peak (or minimum) they get older, more injury-prone, and slower. Our sprinter now runs at 9.98. The next year he's running in the low 10's. After that he runs 10.5 and then his professional career is probably over. 

A linear fit doesn't seem right, since sprinter's don't get faster forever: it's only useful for a short period of time. I would not consider their progression exponential either. No one (well almost no one) jumps from 10.1 in one year to 9.8 the next. If we increase the power and move to cubic, quartic or higher, the R-squared value increases, but the equation gets very dynamic, making modelling difficult. A moving average takes away much of the fluctuation and shows long term trends, but cannot be used to extrapolate and an appropriate period must be chosen.

Note that the extrapolations are probably no good after three years or so. It's all right to make an extrapolation for the next year, but after that your confidence level decreases. Sprinting is a very complex sport and is difficult to accurately predict a race's result.

Of course there are exceptions: Justin Galtin is a big one. His R-squared value is 0.5, so the extrapolation is correct 50% of the time. If we look at his history, this seems more understandable. Gatlin won the 2004 Athens Olympics 100m sprint in 9.85 seconds. However, he was banned in 2006 for drug use. Then he made a comeback in 2010. That year, his best time was 10.09, so many thought that his career was over. But they were wrong. Gatlin ran 9.95 the next year and won the bronze medal at the 2012 London Olympics with a time of 9.79s. He then ran 9.85 in 2013 and broke his personal best with a time of 9.77s at the 2014 Diamond League Final. Other factors to consider about Gatlin's unpredictability are his age (he is 33, quite old for a sprinter) and his previous history of performance-enhancing drug (PED) use.

Here is the graph showing the extrapolations for sprinters' best times up to 2016:


Note that the graph is truncated and only the data after 2011 is included.

The extrapolation suggests the following ranking for fastest sprinters of 2015:

1. Kemar Bailey-Cole (JAM)
2. Nickel Ashmeade (JAM)
3. Justin Gatlin (USA)

The problem with this prediction is that Bailey-Cole's best time is 9.93s and he would have to run .13 seconds faster (that's a lot in sprinting) in order to run his projected time of 9.80s. It's also unlikely that Gatlin will only run in 9.90s when one looks at his previous successes in recent years. Bolt is out of the picture and so are many other top-tier runners.

This projection will improve as sprinters begin to run again in competitions once the sprinting season is in full swing: that will probably be on May 15 during the first IAAF Diamond League event in Doha, Qatar.


U.S. Presidential Primaries 2016 March Polling Averages

Republican Nomination

Three polls have recently been released for the 2016 U.S. Presidential primaries.  According to the poll by ABC/Washington Post, Jeb Bush is leading the Republicans with 21%. The Public Policy Polling (PPP) poll shows Wisconsin governor Scott Walker in first with 20%. The third poll, this one by Fox News, pegs Walker in first with 15%. All three polls show Ted Cruz, who has recently announced his presidential bid, at higher numbers than he has previously had. The ABC/Washington Post Poll has him in third with 12% and the PPP poll puts him in third place as well with 16%. The Fox News poll has him in tied in fourth place with 10%.

I aggregated the ten most recent polls by weighing newer polls more than older polls and then finding the weighted average for each candidate. Here are the current results:

1. Jeb Bush: 16.2%
2. Scott Walker: 15.8%
3. Ben Carson: 9.3%
4. Mike Huckabee: 9%
5. Rand Paul: 8.8%
6. Ted Cruz: 8.6%
7. Marco Rubio: 6.3%
8. Chris Christie: 6%
9. Rick Perry: 2.6%
10. Rick Santorum: 1.8%
11. Bobby Jindal: 1.7%
12. John Kasich: 1.4%

Below is a graph showing the candidates' polling averages after each month in 2015. Note that month 1 means January, 2 means February, and so on.


Bush: Bush had a slight decrease in February, but his polling numbers increased in March, but are not as high as they were in January.

Walker: Walker has experienced the biggest increase this year. He was in 7th place in January with 6%, but now he is in a very close second place, chasing after Bush.

Carson: Carson has decreased since February, but since his decline was less than that of Huckabee, so he snatched third place.

Huckabee: Huckabee reached his peak in February when a CNN poll gave him 17%, but since then his numbers have gone down and he has now fallen to fourth place.

Paul: Rand Paul has been quite consistent so far and he maintains his fifth place standing.

Cruz: After formally declaring that he is running for president, Cruz's polling numbers skyrocketed and he is now in sixth place close behind Paul, Huckabee, and Carson. 

Rubio: The Florida senator has gone up over by almost two percentage points since February and he has overtaken Christie.

Christie: The New Jersey governor has had the biggest fall so far. He was tied in third place in January with 9%, but has since been losing a percent or two every month and has fallen into eighth.
Perry: Rick Perry's numbers are not looking good. Like Christie, his numbers are also going down. In the ABC/Washington Post poll he polled at only 1%.

Santorum: The 2012 GOP nomination race runner-up is in tenth place edging out Jindal and Kasich.

Jindal: Jindal is polling low numbers and during March he was overtaken by Santorum by 0.1%.

Kasich: The Ohio governor rounds up the candidates and is currently at 1.4%.

All twelve of these candidates have a shot at the nomination this early on in the campaign. As declarations of candidacy are announced, straw polls take place, and the year 2016 approaches, anything can still happen in this dynamic political landscape.

Democratic Nomination

The Democratic field is smaller and less changes have taken place so far. Hillary Clinton is way ahead of the back and no one has come close to her in any poll so far.

Here are the current polling averages for the Democrats:

1. Hillary Clinton: 60.2%
2. Joe Biden: 13.2%
3. Elizabeth Warren: 11.7%
4. Bernie Sanders: 3.9%
5. Jim Webb: 1.2%
6. Martin O'Malley: 1%

Below is a graph showing the candidates' polling averages after each month in 2015.


 Clinton: Hillary Clinton is well in the lead and is uncontested in first place.

Biden: The vice president's numbers have slightly decreased  since February and he maintains a small lead over Elizabeth Warren.

Warren: Warren has been slowly moving up and may soon threaten Biden in second place.

Sanders: The independent Vermont senator is in a distant fourth place and he has also made small increases.

Webb: Webb's number's haven't gotten over 2% yet and he will need better results if he wants to win the nomination.

O'Malley: The governor of Maryland's polling averages are slowly decreasing since January and he is in last place.

Note that Andrew Cuomo, New York's governor, is not on the list. Several recent polls have not included him and he has stated that he won't run if Clinton runs.

So for the Democrats, the landscape is more static and we'll probably have to wait for a couple of months until we see some movement.

EKOS Poll: Outlier or a New Trend?

A poll for the 2015 Canadian federal election published by EKOS a few days ago seems very out of place. According to the poll, the Conservatives are in the lead with only 31.8%. The Liberals are in second at 28.5% with the NDP in third place with 23.2%. The Green Party and the Bloc Quebecois trail at 8.7% and 4.7% respectively.

The poll shows low numbers for the Tories, but more so for the Liberals. Trudeau and his party have never polled lower than 30% since September 2013, one and a half years ago. While EKOS displays lower numbers than most polling firms do (the most recent Abacus poll shows the Liberals at 34% and the Conservatives at 33%), the question is if this poll is just an outlier and should be ignored.

While I think that this poll is very likely an outlier due to its low numbers and the Abacus poll showing a far different picture, it does show that the Liberals need to improve their numbers if they intend to replace Harper. Since the fall of 2014, the Liberals have been on a decline. Other than the polls by Forum, they have not managed to poll higher than 35%.

The Conservatives are first in this poll, but they should worry as well. In several recent polls, Conservatives seem to have lost some of their forward momentum and their polling numbers are declining (but less rapidly than for the Liberals). 

This EKOS poll is good news for Thomas Mulcair. This has been the NDP's best poll since late January 2015 and shows the NDP gaining ground. 

The Greens are also polling at high levels, but EKOS seems to be the only polling firm so far that is giving the Green Party over 7%, possibly due the house effect and how EKOS' polls are conducted.

The Bloc Quebecois are in fifth with 4.7% and have remained mostly stable so far.

4311 Canadians were polled using Interactive Voice Response (IVR) with a margin of error of ±1.5 pp.

The question of whether or not this poll is an outlier will hopefully be answered when the next EKOS poll comes out this Friday.