

The graph below shows the polling averages up to March 2015. Month 1 means January, 2 means February, and so on.
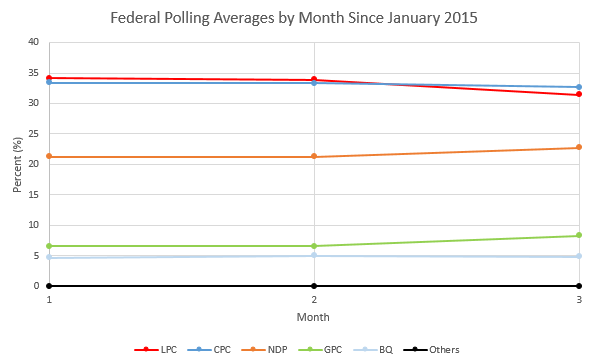
Conservatives: The Tories have dropped by 0.6 percentage points since February, but their decline has been less severe than that of the Liberals, so they have taken the lead.
Liberals: The Liberals have experienced a fall of 2.7% since January and have been overtaken by the Conservatives.
NDP: The NDP have increased from 21.3% in February to 22.7% in March, but there is still a big difference between them and second place.
Green Party: The Greens have separated themselves from the Bloc Quebecois and rose by 1.7 percentage points.
Bloc Quebecois: The Bloc have been quite consistent and are generally polling under 5%.
Others: Other parties and independents currently have 0% of the vote.
Methodology
In order to determine the percentage for each party, the last ten national polls are taken. Polls are weighted based on recency and sample size. Then a weighted average is taken. Pollster bias (the house effect) is not included in this model. I am currently working on this.
Only national polls are considered for the seat projection model, so this part of the projection is less accurate. The method I use is based on the cube rule. I call it the square rule. The percentage of seats each party receives is equal to the popular vote percentage for that party squared divided by the sum of the squares of all the parties. If this method is applied to the popular vote percentage for the 2011 Canadian federal election, the Conservatives would receive 166 seats, the exact same amount they won. The square rule method also gave the correct number of seats for the Bloc and the Greens, and was off by only four for the Liberals and NDP.
Cube rule is more accurate for a two-party system, such as in the United States and in a multi-party system like in Canada, it overestimates the winner's seats and underestimates those who had much less of the popular vote. I have considered basing the model on regional polls, but pollsters are inconsistent with this and the sample size is much smaller leading to a high margin of error. Some poll aggregators use a regional swing model and apply changes to each riding. The problem with this is that it takes a lot of time, it does not always take into account local factors in that riding, and the seats were redistributed from 308 to 338 seats in 2012 so all the 2011 results in each riding would have to be re-aggregated.
The polling aggregation methodology used will be further discussed in an upcoming post.
Here are some other very good Canadian poll aggregation websites:
http://www.threehundredeight.com/
http://www.lispop.ca/seatprojections.html
http://lispop.ca/elections/fed2015.html
On the American side, here are some more:
http://www.realclearpolitics.com/elections/2016/
http://fivethirtyeight.com/
No comments:
Post a Comment