A few days ago, I wrote a post titled "EKOS Poll: Outlier or New Trend?" (http://logbook2015.blogspot.ca/2015/04/blog-post_7.html) which discussed a recent poll that showed the Liberals polling under 29%, a figure not achieved since June 2013. However, EKOS released a new poll less than a week later pegging the Conservatives at 31.9% and the Liberals at 27.6%. Liberals have not polled that low since the spring of 2013. A Forum Research poll was released the same day which had the Liberals leading the Conservatives 34% to 31%. The Conservatives' numbers were close, but there is a difference of six percentage points for the Liberals. So are these EKOS polls outliers?
I looked up all the polls from 2015 and did some analysis. I found the mean, median, standard deviation, Q1, and Q3. Mean is the average and standard deviation measures on average how far a data point is from the mean. Population standard deviation is for larger sets of data, while sample deviation is for less data points, with more room for error. Q1 is the first quartile and represents the 25th percentile for the data (the bottom 25%). Q3 is the third quartile and is the cutoff for 75% of the data. The median, or middle number, is sometimes known as Q2. This diagram gives an illustration of the quartiles:
It's a bit like cutting a rectangle into equal four pieces: each cut represents a quartile
The interquartile range, or IQR, is the difference between Q3 and Q1 and represents the middle 50% of the data. The following equation can be used to find outliers:
x is not an outlier if x belongs to the set [ Q1 - 1.5IQR , Q3 + 1.5IQR ]
Applying this formula to the polling data for the Liberals tells us that the poll is not an outlier if the percentage is from 30.25% to 35.35%, all inclusive. So polls outside this range interval would be considered outliers. Hence, we have 5 outliers. Three of them are earlier Forum polls that give the Liberals 36%, 37%, and 39%. We also have the two EKOS polls which have the Liberals at 28.5% and 27.6%.
If the distribution of polls is normal, probabilities can be calculated using z-scores. The following equation is used to test for skewness.
Pearson's Index (PI) = 3(mean-median)/sample standard deviation
If |PI| is less than 1, the data is not significantly skewed. For our data we got PI = -0.04, so there is hardly any skewness. We can now go ahead and find probabilities.
Since the distribution is normal, z-scores can be used to find probabilities. z-scores measure how many standard deviations a data point is from the mean. The below formula is used:
z-score = (data point x - mean)/population standard deviation.
z-scores can be converted into probabilities using tables. So using this method we find the following probabilities:
Greater than 35%: 22%
Greater than 36%: 12%
Greater than 39%: 2%
Less than 29%: 5%
Less than 28%: 2%
The below histogram gives a visual. All of the outliers are located on the tails. They are all very unlikely to occur.
So mathematically, these polls are outliers. However, the assumption that is being made here is that nothing really changed from January to March, so the date the poll was taken doesn't matter. But it does. So let's take a look at 2015 polls for the Liberals over time.
The below graph illustrates all of the 2015 polls. There is a small downward trend, but a linear fit is very poor with a low R-squared value due to all the fluctuation.
A 5-poll moving average looks better, but it is still quite jagged.
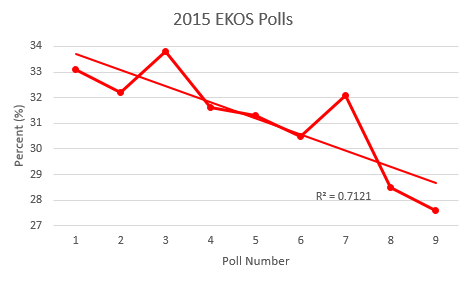
Here is a line graph showing all 2015 EKOS polls for the Liberals:
The downward trend is far more obvious here and there is a fairly high R-squared value and a high R value implying a strong correlation (R is the correlation coefficient, while R-squared is just for the fit).
Now let's take a look at Forum's polls.
The R-squared value is very low despite a small negative correlation, but there are not as many data points here so we much be cautious before jumping to conclusions.
This has been a rather lengthy analysis, but we can learn that the EKOS poll may not be an outlier after all. It is definitely on the lower end of the spectrum and there may have been some unintentional bias in play (this will be analyzed in a future post), but since the Liberals are currently sliding downwards in most polls and because EKOS surveyed 4000 people in each poll with a small margin of error, these are not freak polls and probably do represent the current political landscape. We cannot jump to any conclusions, such as this being because of the Liberals' support for Bill C-51, but we do know that the Liberals no longer maintain the huge lead they held over the Tories only a few months ago.


No comments:
Post a Comment